anatomy of a HN hit
tl;dr: screenshots of data from HN traffic
read time: 8 minutes
This past Sunday, I posted an article to Hacker News
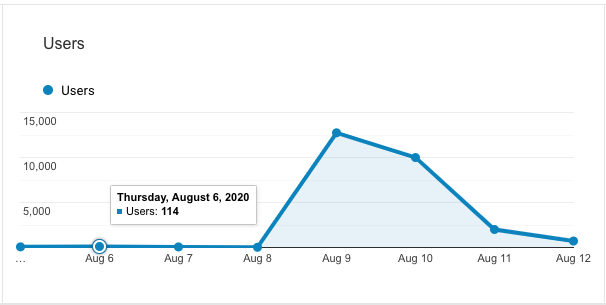
They seemed to like it. It got 554 points, 194 comments, and stayed on the front page for about a day and a half. It drove 24,000¹ users to my site in the following 72 hours
Below, I'll talk a little bit about why I think it did well, share (a bunch of) numbers, and summarize what I learned from it
table of contents:
why was it a hit
I write a fair bit - currently 21 posts on this site plus a fair bit more on my Twitter. Before this week, I hadn't promoted any content outside of Twitter, so take my thoughts here with a meaningful grain of salt.
If I had to guess, the positive response was a combo of:
- the title² was quite clickbait-y and spoke to a common pain point
- the content felt technical but was accessible to non-engineers
- the content had two dozen short, broadly-work-related examples
- similarly, the use of copy-paste-able snippets let a reader get value in < 30 seconds
- the discussed concept is broadly applicable to many use cases (this drove a lot of comments)
- I posted at midday Sunday (this article concluded that was the best time, so I ran with it)
- clickable Table of Contents above the fold
- it's on my personal (non-corporate) website
²Interestingly, the Hacker News team editorialized my title (it changed to Dorking: the use of search engines to find very specific data some time after submitting), so I can surmise the mods tacitly approved or supported the post.
Things that appeared to not matter:
- the article was from April
- the content was effectively a tutorial (Hacker News allegedly downranks tutorials)
- some of the content didn't work as expected or was out of date (which was pointed out in the comments). the top comment was a listing of my mistakes!
- I pushed new versions of the article a half dozen times on the launch day, fixing the errors people pointed out
- I responded to a half dozen HN comments
- average page load speed was 2.3s; the site doesn't use a CDN, so some locations saw bad performance (ex: the average for France was 11s!)
With that out of the way, let's talk about the results:
numbers
(figures are all from Google Analytics)³

The traffic was almost entirely new users (usual site traffic: ~25/day). Visitors spent half a minute onsite on average, and read 1.33 pages

One in 10 visitors returned, and those who did spent about 3x longer on average.
These averages are somewhat misleading, however:

92% of sessions were 10 seconds or less. Page depth tells a similar story - 90% of sessions never scrolled down!
Important note: Google Analytics marks any session with only one pageview as 0 second duration source
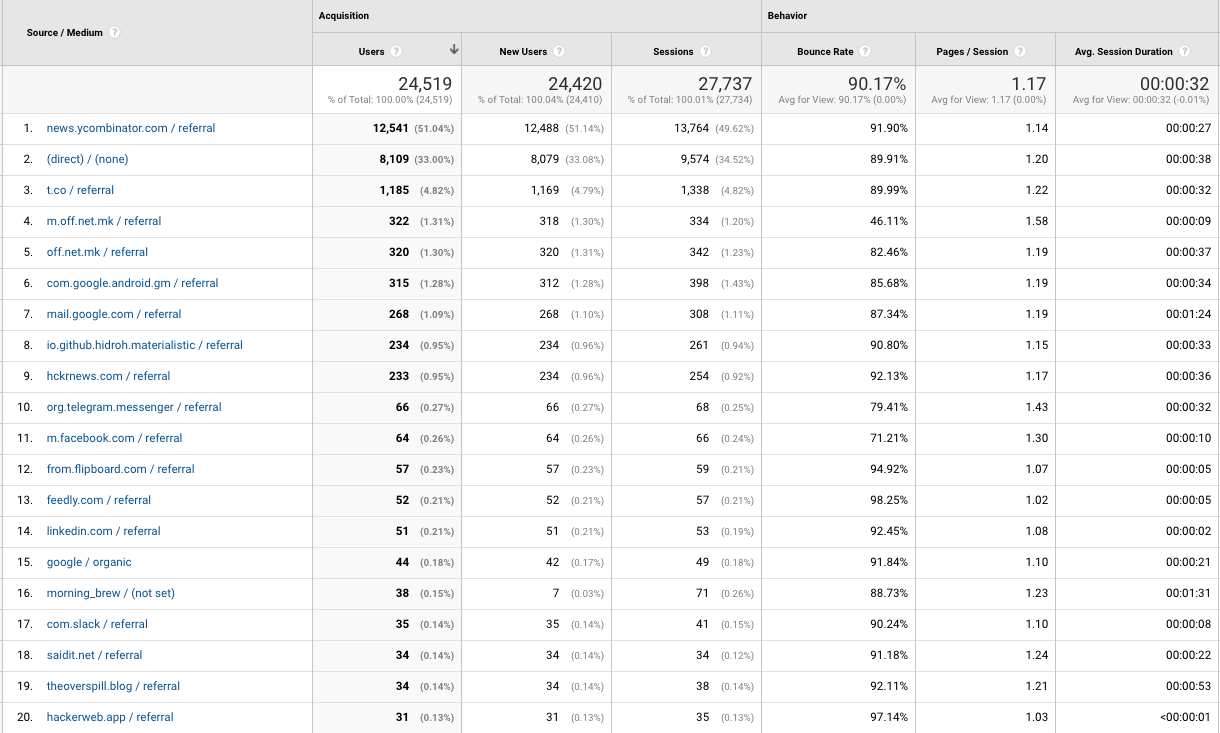
The traffic source breakdown was equally surprising:

Direct is the catchall for no-other-attribution-found, so some HN-reading-apps (as well as people texting and emailing the link) are marked as Direct.
Referral was a mix of syndicators (Materialistic HN, hckernews, flipboard, feedly), email clients, and other social channels (and a North Macedonian newspaper!)

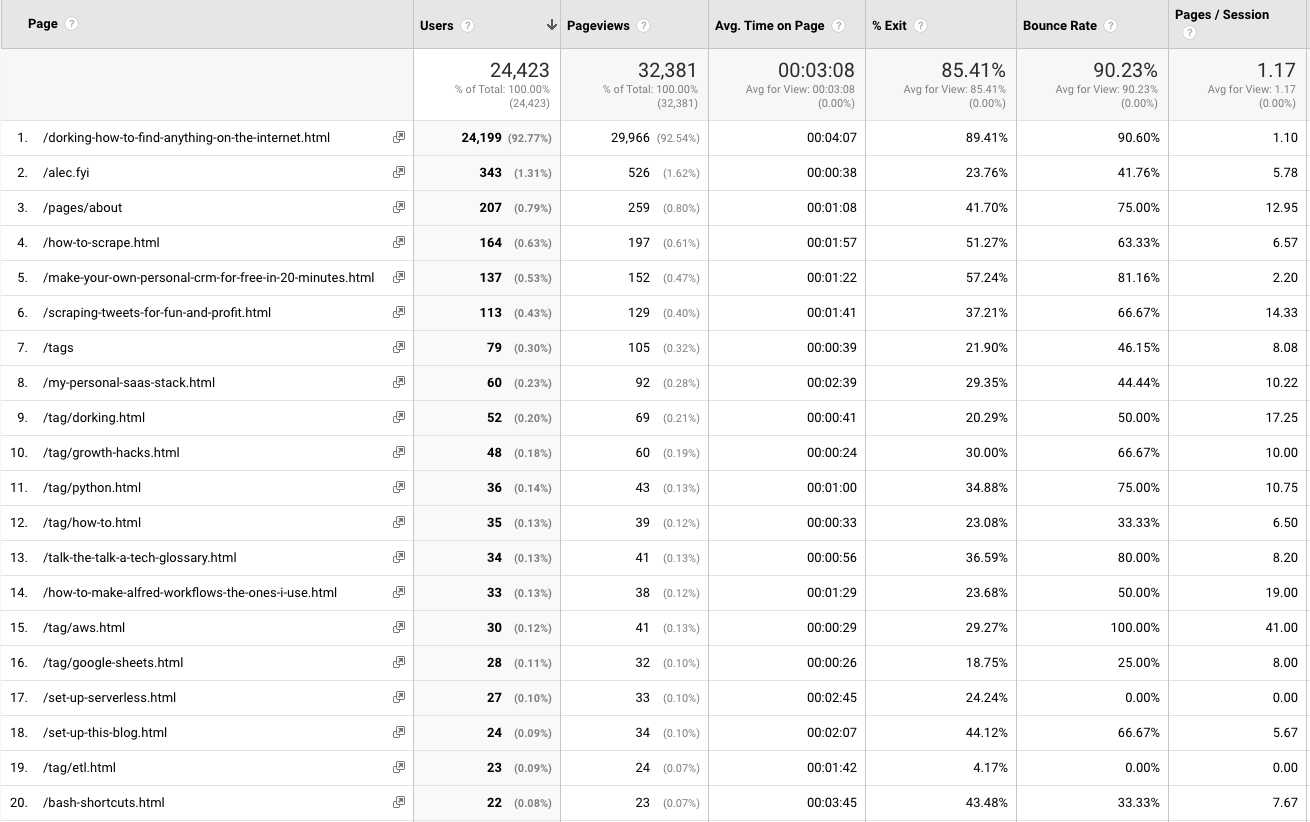
Finally, some folks migrated through the rest of site. 7.5% of total pageviews were of other pages, including 260 visits to the About Page.

Do note the How To Scrape article was linked in the Dorking article, so it got a bump from the HN traffic.
demographics
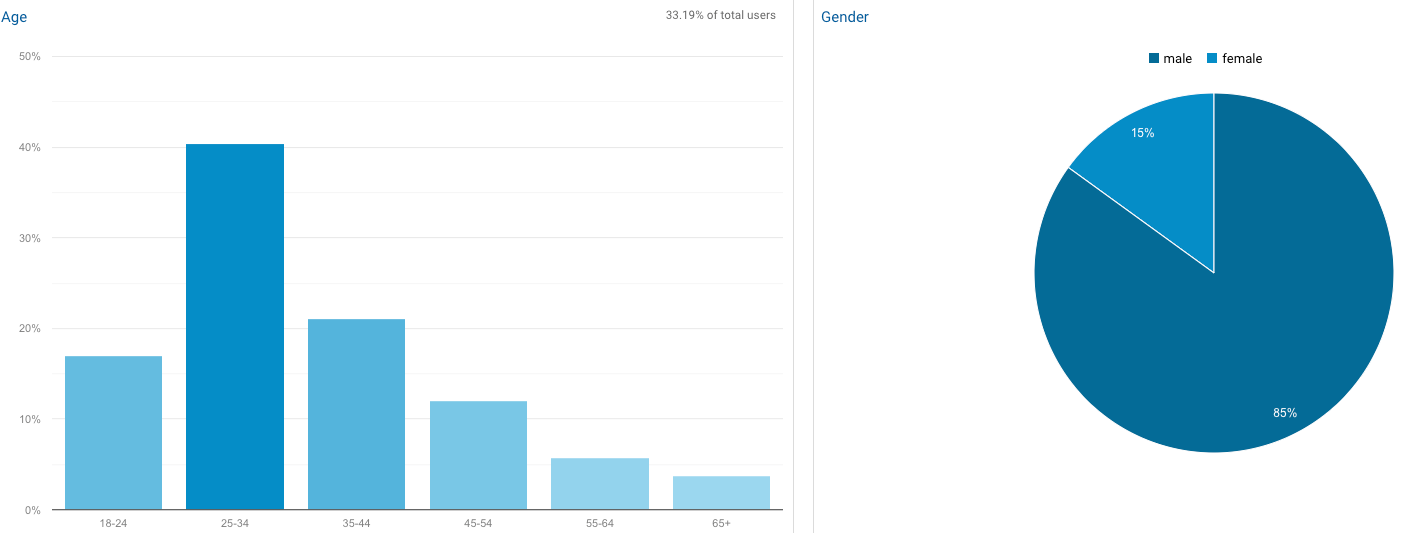
I had previously enabled a Google Analytics setting called Demographics and Interest Reports that provides anonymous aggregated data about a (presumably representative) portion of the website visitors (in this case, 34%).

Let's briefly walk through what the Hacker News traffic's demographics looks like. Please note: these figures are likely similar to, but certainly not precisely the same as, HN's overall readership.

Mobile traffic was a majority of the overall - I was surprised to see this given the lack of a good Hacker News app⁵. Also surprising: mobile traffic had effectively the same Pages/Session and Avg. Session Duration as desktop traffic. This site's mobile usability is ... not good (you have to zoom in to see anything)

Age and gender tend predominantly young and male. When considering learnings from this traffic (ex: the popularity of the Scraping article), it's important to keep in mind that this traffic is not at all representative of the general public.

Country location data shows us only 59% of visitors live in primarily-English-speaking countries. The accept-language header data (not shown) shows 86% have an English-default browser set, though. Perhaps most interesting of all, the 14% non-English browsers had comparable Bounce Rate and Avg. Session Duration values!
Finally, about half of traffic was from Apple devices, and the rest from Android / Windows / Linux

the value
So how much money did I make from all these strangers visiting my website?
actually, -$40
I paid out my content bounty thrice (waiting on a fourth, as well):

I don't run ads, I don't have a newsletter, I don't currently have a product to sell⁶, and I'm not accepting new consulting clients.
Only 10 people from the 24,000 made it to my consulting page, which is intentionally rather hidden.
That said, I did get:
- 30 or so Twitter followers
- 9 people congratulated me
- 7 emails (it's on every page. feel very free to do so)
- 700 words of HN arguments about use of the word
deprecated(lol) - 48 article shares on Twitter (all organic; I didn't ask anyone to)
If I were intending to monetize this traffic, I would recommend:
- set up an email capture in the sidebar and in the footer. With a (e.g.) 2% user-to-signup conversion rate, that'd be 300 people for your newsletter!
- have an obvious "Buy This Thing" CTA at the end of the article and elsewhere on the site (ex: the about page)
- retarget users with >10 second session duration
in sum
Appreciate y'all reading that article (and this one!)
Similarly, big shoutout to the folks who helped me improve the article's content - Tejas, Chris, Ian, Brandon, and others.
With all that being said, what did I really get from the whole experience?
All my Google Analytics charts are super zoomed out now. Thanks y'all.

¹ Based on the current decay rate, I'd guess it will end up being around 26,000 total
³ Numbers may not add up to the same total between screenshots, as they were taken over the course of several hours
⁵ My opinion
⁶ Coming soon!
Thanks for reading. Questions or comments? 👉🏻 alec@contextify.io